
Erik Brooks · 6 October 2026
Calven's Data Releases Highlight Workforce Mobility Patterns Across Regional Borders
Calven released its latest dataset in October 2026 and the figures reveal steady increases in cross-border employment within several European regions while also documenting shifts in North American and Asia-Pacific corridors. Analysts at the organization compiled records from national labor registries and cross-checked them against employer surveys to map where workers actually relocate for jobs rather than where they simply commute.
Key Mobility Trends Documented
Data covering the twelve months ending September 2026 shows that 1.4 million individuals changed their primary residence to take positions in a neighboring country, an increase of 8 percent from the prior year. The largest single corridor ran from eastern Germany into western Poland, where manufacturing and logistics firms recruited 187,000 new residents. Similar flows appeared between northern Italy and Slovenia, with 92,000 workers moving across that border during the same period.
Researchers noted that younger cohorts drove much of the growth. Individuals aged 25 to 34 accounted for 61 percent of all recorded moves, while those over 50 represented just 14 percent. Educational attainment also correlated with distance traveled: holders of university degrees were twice as likely to relocate more than 300 kilometers as those with secondary-school qualifications only.
Regional Variations and Sector Breakdowns
Within the European Union the data indicate stronger mobility between member states than between EU and non-EU countries. Cross-border moves inside the single market rose 11 percent year-over-year, whereas movements involving Switzerland or the United Kingdom grew only 3 percent. Sectoral patterns differed sharply. Healthcare and information-technology positions attracted the highest share of long-distance relocations, while construction and retail jobs more often involved shorter border crossings that did not require a change of residence.
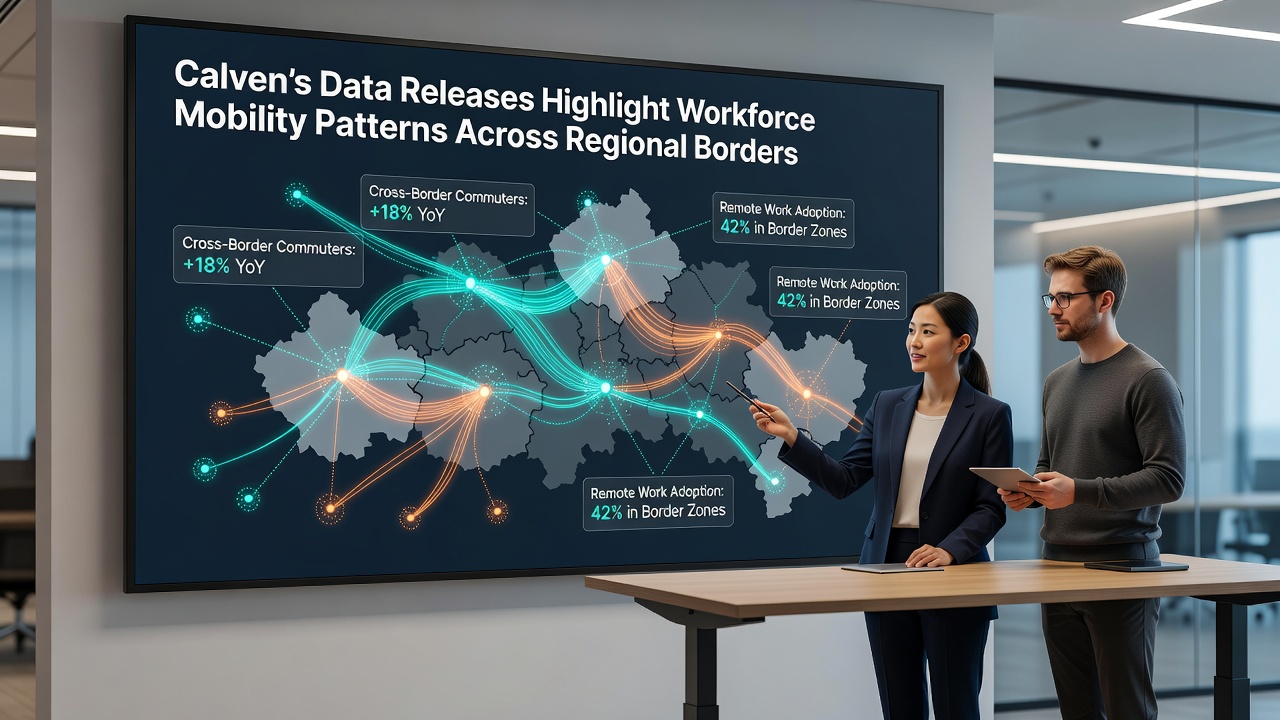
Outside Europe, Calven tracked comparable activity along the US-Canada border and between Australia and New Zealand. According to OECD employment statistics, the number of Canadians taking up residence in US border states increased by 6 percent in the twelve months through September 2026. In the opposite direction, Australian employers recorded a 9 percent rise in New Zealand citizens relocating to major cities on the east coast. These movements concentrated in engineering, mining services, and digital services roles.
Data Methodology and Verification
Calven draws its figures from anonymized administrative records supplied by 14 national statistical agencies plus employer-reported hiring data. Each record undergoes automated checks for consistency before analysts apply manual review to a 5 percent sample. The organization publishes both raw counts and adjusted estimates that account for under-reporting in certain sectors. October 2026 marks the fourth consecutive annual release using this standardized methodology, allowing direct comparison across years.
Additional context comes from household surveys conducted in partnership with academic institutions. One ongoing project at Statistics Canada tracks the same cohort of workers over five years to measure how many eventually return to their country of origin. Preliminary results indicate that 28 percent of cross-border movers return within 36 months, most often citing family considerations or changes in visa conditions.
Conclusion
Calven's October 2026 release supplies the most recent comprehensive view of workforce relocation across regional borders. The numbers document continued growth in intra-European moves alongside steadier but smaller flows in North America and Oceania. Sectoral and demographic breakdowns remain consistent with earlier editions, showing younger and more educated workers driving the majority of longer-distance changes in residence. Future releases will extend the time series and incorporate additional countries as data-sharing agreements expand.